Active vs. Passive Investing: Which Strategy Yields the Highest Returns?
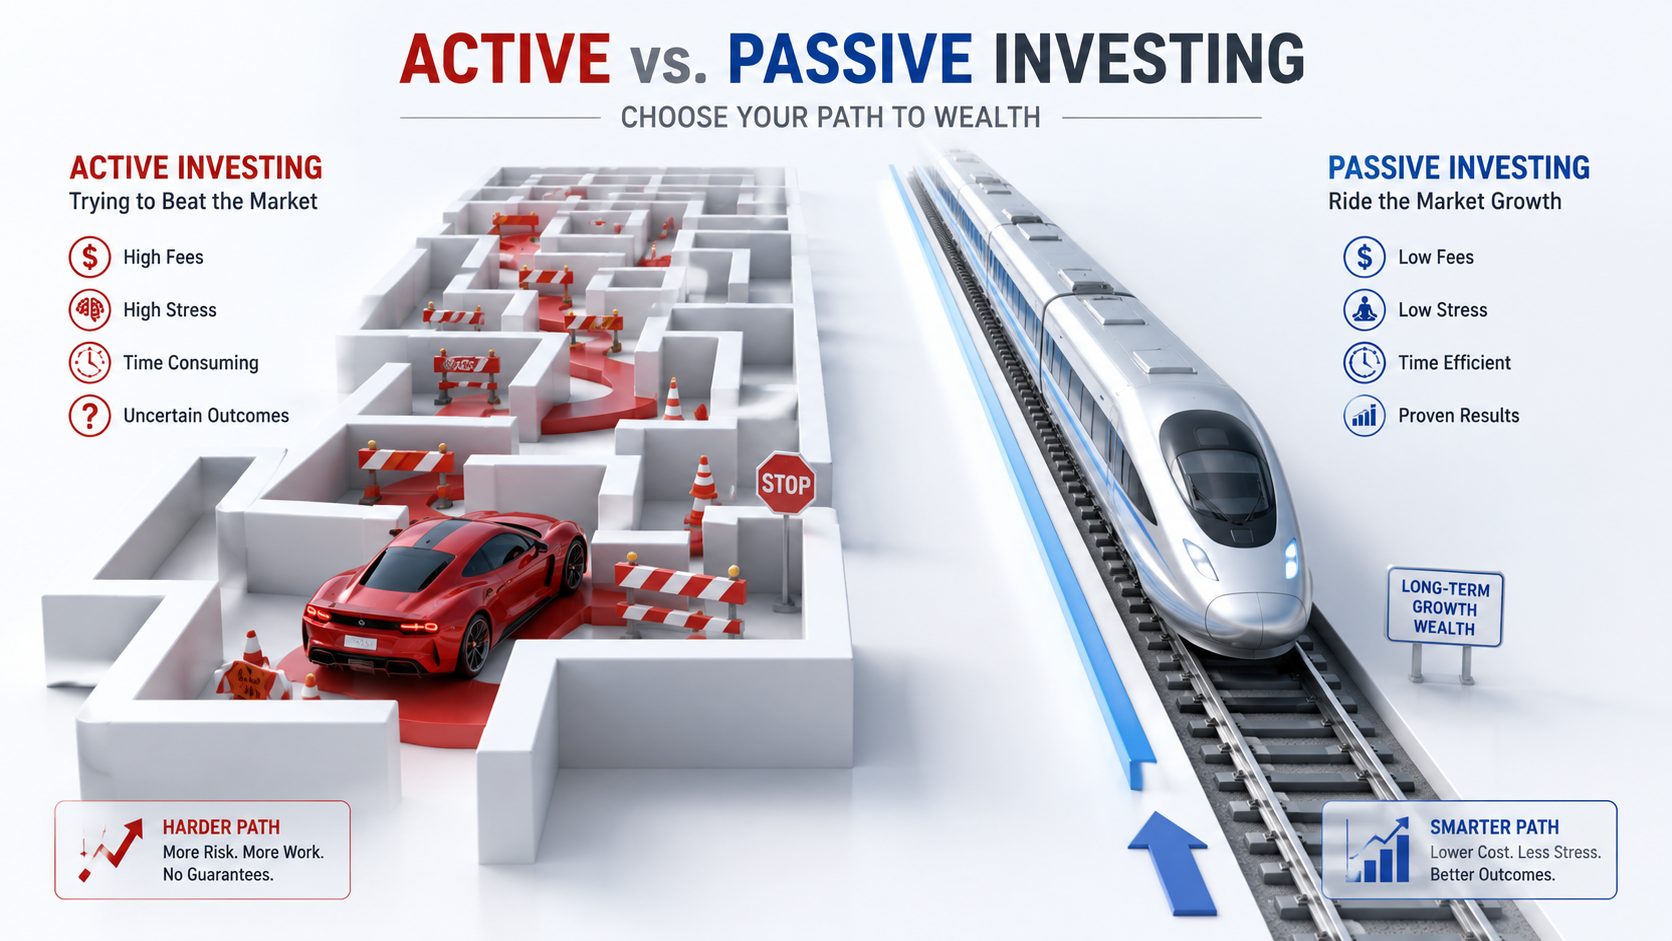
To choose between active and passive investing, you must compare the total cost of ownership (expense ratios) and check historical performance data: active investing relies on high-fee portfolio managers attempting to beat the market through stock picking, whereas passive investing utilizes low-cost index funds tracking a benchmark (like the S&P 500) to deliver identical market returns at a fraction of the cost.
Quick Answer Summary
- Active Investing: Portfolio managers research, buy, and sell individual stocks to "beat the market." They charge high fees (typically 1.0% to 1.5% annually) and incur transaction costs.
- Passive Investing: Funds track a pre-set index (like the S&P 500) automatically. Fees are extremely low (often 0.03% to 0.05% annually), and trading is minimal.
- The Verdict: Because active managers fail to beat the market consistently, and their high fees erode compound growth, low-cost index funds outperform active mutual funds in over 90% of cases over 15-year horizons.
The Cost of Active Management: Expense Ratios & Fee Drag
When you buy a mutual fund, you pay an annual management fee called the expense ratio, expressed as a percentage of your assets. While a 1.0% fee might sound small, its compound impact over a 30-year investing horizon is devastating.
Let's compare two investment products:
- Passive Index Fund: Expense ratio = 0.03% (you pay $3 per year for every $10,000 invested).
- Active Mutual Fund: Expense ratio = 1.20% (you pay $120 per year for every $10,000 invested).
Case Study: The Cost of Fee Drag Over 30 Years
Let's analyze Sarah, who invests $10,000 at age 25. We assume both the active and passive funds achieve a 9.0% gross annual market return before fees are deducted. She lets the money compound for 30 years until age 55:
Scenario A: Low-Cost Passive Index Fund (0.03% Fee)
- Net Annual Return: 8.97% (9.0% - 0.03%)
- Future Value at Age 55: $131,520
- Total Fees Paid: $480
Scenario B: Active Mutual Fund (1.20% Fee)
- Net Annual Return: 7.80% (9.0% - 1.20%)
- Future Value at Age 55: $95,180
- Total Fees Paid: $36,340
Sarah's $10,000 after 30 years at 9% gross
Verdict: By choosing the active mutual fund, Sarah lost $36,340 (or 27.6% of her final portfolio value) strictly to fee drag! The active manager did not beat the market; they simply charged a high fee to deliver the same market return. This highlights why keeping investment expenses low is critical.
The SPIVA Scorecard: Do Active Managers Actually Beat the Market?
Proponents of active investing claim that professional managers can select winning stocks and avoid market downturns. However, the SPIVA (S&P Active vs. Passive) Scorecard, which tracks the performance of active funds against their index benchmarks globally, reveals a harsh reality:
- 1 Year: 60% of active large-cap managers underperform the S&P 500.
- 5 Years: 78% underperform the benchmark.
- 10 Years: 85% underperform the benchmark.
- 15 Years: Over 90% of active managers fail to beat the index.
Share of active large-cap managers who trail the S&P 500
Professional stock picking is a losing game over long horizons. The market is highly efficient, meaning all public information is already priced into stocks. It is nearly impossible to consistently pick winners and time the market year after year.
How to Build a Low-Cost Passive Portfolio
If you want to capitalize on passive investing, use these guidelines to build your portfolio:
- Select Broad-Market Index Funds: Choose ETFs or mutual funds that track large, diversified indexes, such as the S&P 500 (US large-cap), Russell 2000 (US small-cap), or MSCI World (global developed markets).
- Check the Expense Ratio: Only select funds with expense ratios below 0.10% (ideally below 0.05%). Major asset managers like Vanguard, Schwab, and BlackRock (iShares) offer broad index funds at rock-bottom costs.
- Automate Contributions: Use a Dollar-Cost Average (DCA) strategy to automatically invest a set amount from your paycheck monthly, avoiding the temptation to time the market.
- Reinvest Dividends: Set your brokerage account to automatically reinvest dividends (DRIP) to accelerate compound growth.
Use the Compound Interest Calculator to project your portfolio balance and see how lowering fees accelerates your wealth.
Advanced Strategic Implementation & Optimization for Investors
Deciding between active trading and passive index fund investing determines your long-term portfolio returns and time commitment.
Passive Portfolio Checklist
- Prioritize Broad Market Index Funds: Focus on ETFs and mutual funds tracking major indices like the S&P 500, MSCI World, or CRSP.
- Minimize Management Fees: Select funds with expense ratios below 0.15% to prevent fee drag.
- Rebalance Annually: Adjust asset allocations once a year to maintain your target risk profile.
Step-by-Step Passive Investing Plan
- Select a Discount Brokerage: Open a low-fee investment account with a reputable custodian.
- Automate Monthly Buy Rules: Set up recurring purchases of diversified global equity ETFs.
- Enable Dividend Reinvestment (DRIP): Ensure all cash dividends are automatically used to buy fractional shares.
- Ignore Market Noise: Avoid checking your portfolio daily; focus on long-term compound growth.
Common Pitfalls & Audit Warnings
- Chasing Yesterday's Winners: Investing in actively managed mutual funds based on past performance typically leads to future underperformance.
- Trading Too Frequently: High turnover rates in active accounts generate substantial transaction costs and taxable events.
- Underestimating Index Coverage: Believing passive investing lacks diversification is incorrect; global index funds hold thousands of stocks across sectors.
Advanced Investment Compounding & Equity Scenario Modeling
We compare the 25-year results of active stock picking versus passive index fund investing.
Investment Performance Table
| Metric | Investor A: Active Trader | Investor B: Passive Indexer |
|---|---|---|
| Initial Investment | $10,000 | $10,000 |
| Monthly Deposit | $500 | $500 |
| Gross Annual Return | 9.0% | 8.0% |
| Annual Management Fees | 1.8% (Active Fees + Drag) | 0.05% (Passive ETF) |
| Net Annual Return | 7.2% | 7.95% |
| Portfolio (Year 25) | $398,500 | $454,200 |
Step-by-Step Fee Drag Calculation
Investor A: Active Fee Drag Math
- Fee Slices: 1.5% management fee plus 0.3% transaction cost drag = 1.8% total annual cost.
- Net Returns: Even if the active manager beats the market index by 1% (9% gross), the fees reduce net returns to 7.2%.
- The Loss: Forfeits $55,700 in portfolio value to the fund manager over 25 years.
4. The 1% Fee Effect Over 30 Years: How Much Active Funds Cost You
When investing in mutual funds, a 1% fee difference might seem small, but it compounding can have a devastating impact on your long-term wealth. Let's look at a math comparison:
The Math Breakdown
Assume you invest $10,000 as a lump sum and contribute $500 per month for 30 years, earning a 9% gross annual return:
- Index Fund (0.05% fee): Net return of 8.95%.
- Final Balance: $908,000
- Active Mutual Fund (1.05% fee): Net return of 7.95%.
- Final Balance: $738,000
By choosing a fund with a 1.05% fee instead of a 0.05% index fund, you lose $170,000 of your retirement wealth — representing nearly 19% of your potential nest egg eaten away by fee drag.
$500/month for 30 years: the 1% fee difference
5. Factor Investing: The Middle Ground Between Active and Passive
If you want to beat the market index without paying high fees for active managers, Factor Investing (also known as Smart Beta) is a modern compromise.
Factor investing targets specific drivers of return that have historically outperformed the broad market over long periods, such as Value (undervalued stocks), Momentum (stocks showing upward trends), or Quality (companies with strong balance sheets). Many index fund providers offer low-cost ETFs that track these factors for a fraction of the cost of active funds.
6. Understanding Tracking Error in Passive Index Funds
Even though passive index funds aim to replicate the return of a benchmark index (like the S&P 500 or FTSE 100), their performance will differ slightly due to tracking error.
Tracking error is caused by:
- Transaction Costs: Fees the fund pays to buy and sell stocks when rebalancing.
- Cash Drag: Holding small amounts of cash to process investor redemptions.
- Expense Ratios: The fund's annual management fee.
When comparing index funds, choose the fund with the lowest tracking error and the lowest expense ratio to ensure you receive the closest match to the index's return.
7. How Often Should You Rebalance Your Passive Portfolio?
Over time, different assets in your portfolio will grow at different rates, causing your asset allocation to drift. To maintain your target risk profile, you should rebalance.
- Calendar Rebalancing: Rebalancing on a set schedule, such as once a year or every six months.
- Percentage Threshold Rebalancing: Rebalancing only when an asset class drifts by more than 5% from its target allocation.
For most passive investors, annual rebalancing is sufficient and keeps transaction costs and tax events to a minimum.
8. What is the Core-Satellite Investing Strategy?
If you want to combine the security of passive investing with the potential outperformance of active selection, you can use the Core-Satellite Investing Strategy.
- The Core (70% to 90% of portfolio): The foundation of your portfolio is allocated to low-cost, diversified passive index funds (like a global stock market ETF or an S&P 500 fund). This keeps your fees low and ensures you match market returns.
- The Satellites (10% to 30% of portfolio): You allocate small portions of your capital to active investments, individual stocks, or sector-specific funds where you believe you have high conviction.
This approach limits your downside risk while allowing you to express your individual financial views without exposing your entire nest egg to active manager underperformance.